Failover Weekly No. 25
Warm Is a Resource
Why the Fleet That Recovered Still Cannot Carry Your Traffic
Last week, I argued that failover is a purchase order, that recovery is an entitlement problem before it is an architecture problem. We talked about the uncomfortable reality that having a perfectly designed recovery architecture means very little if the capacity you intend to recover into is not actually available when you need it.
This week, I want to take that argument a little further, because there is another kind of capacity that rarely appears in a recovery plan, even though entire applications quietly depend on it.
It is not something you can simply reserve in advance, and it does not appear as a line item on your infrastructure bill. You can have all the compute you asked for, every service quota correctly configured, every load balancer reporting healthy targets, and still discover that your recovered application cannot handle the traffic it was designed to serve.
The missing resource is warmth. More specifically, the accumulated state that makes your application efficient under normal conditions.
And when that state disappears, the system you thought you had recovered can behave like a completely different system.
When everything recovered, except the application
Let me start with a ticketing platform. It is a composite scenario, drawn from recurring architectural patterns rather than a single identifiable customer incident, but the underlying problem will be familiar to anyone who has spent enough time around distributed systems.
The team had taken disaster recovery seriously. They had validated their service quotas in the standby AWS Region, checked the applied values rather than assuming the defaults would be sufficient, accounted for the compute capacity they needed, and made sure their instance families and deployment configurations were compatible with the recovery environment.
They had also done something that often gets overlooked: they had considered the actual infrastructure costs of maintaining their recovery posture. They were not expecting capacity to magically materialize when a regional impairment occurred. They understood the difference between an architecture diagram and a capacity entitlement.
So when the primary Region experienced an impairment, the recovery process initially looked exactly as it should. Instances launched, the application started, targets registered with the load balancers, and the health checks turned green. Traffic was redirected to the standby Region, where the newly active application fleet began processing requests.
For a brief moment, it looked like a successful recovery.
Then, roughly ninety seconds later, the catalogue database began approaching full CPU utilization. Request latency increased, connections accumulated, and application instances started failing their health checks. The infrastructure that had just recovered was now struggling to remain available.
The natural instinct was to investigate the failover itself. Had something been deployed incorrectly? Was an application setting missing? Was the database undersized? Had the traffic shift happened too quickly?
The answer was more interesting, because almost everything in the infrastructure recovery had worked as intended.
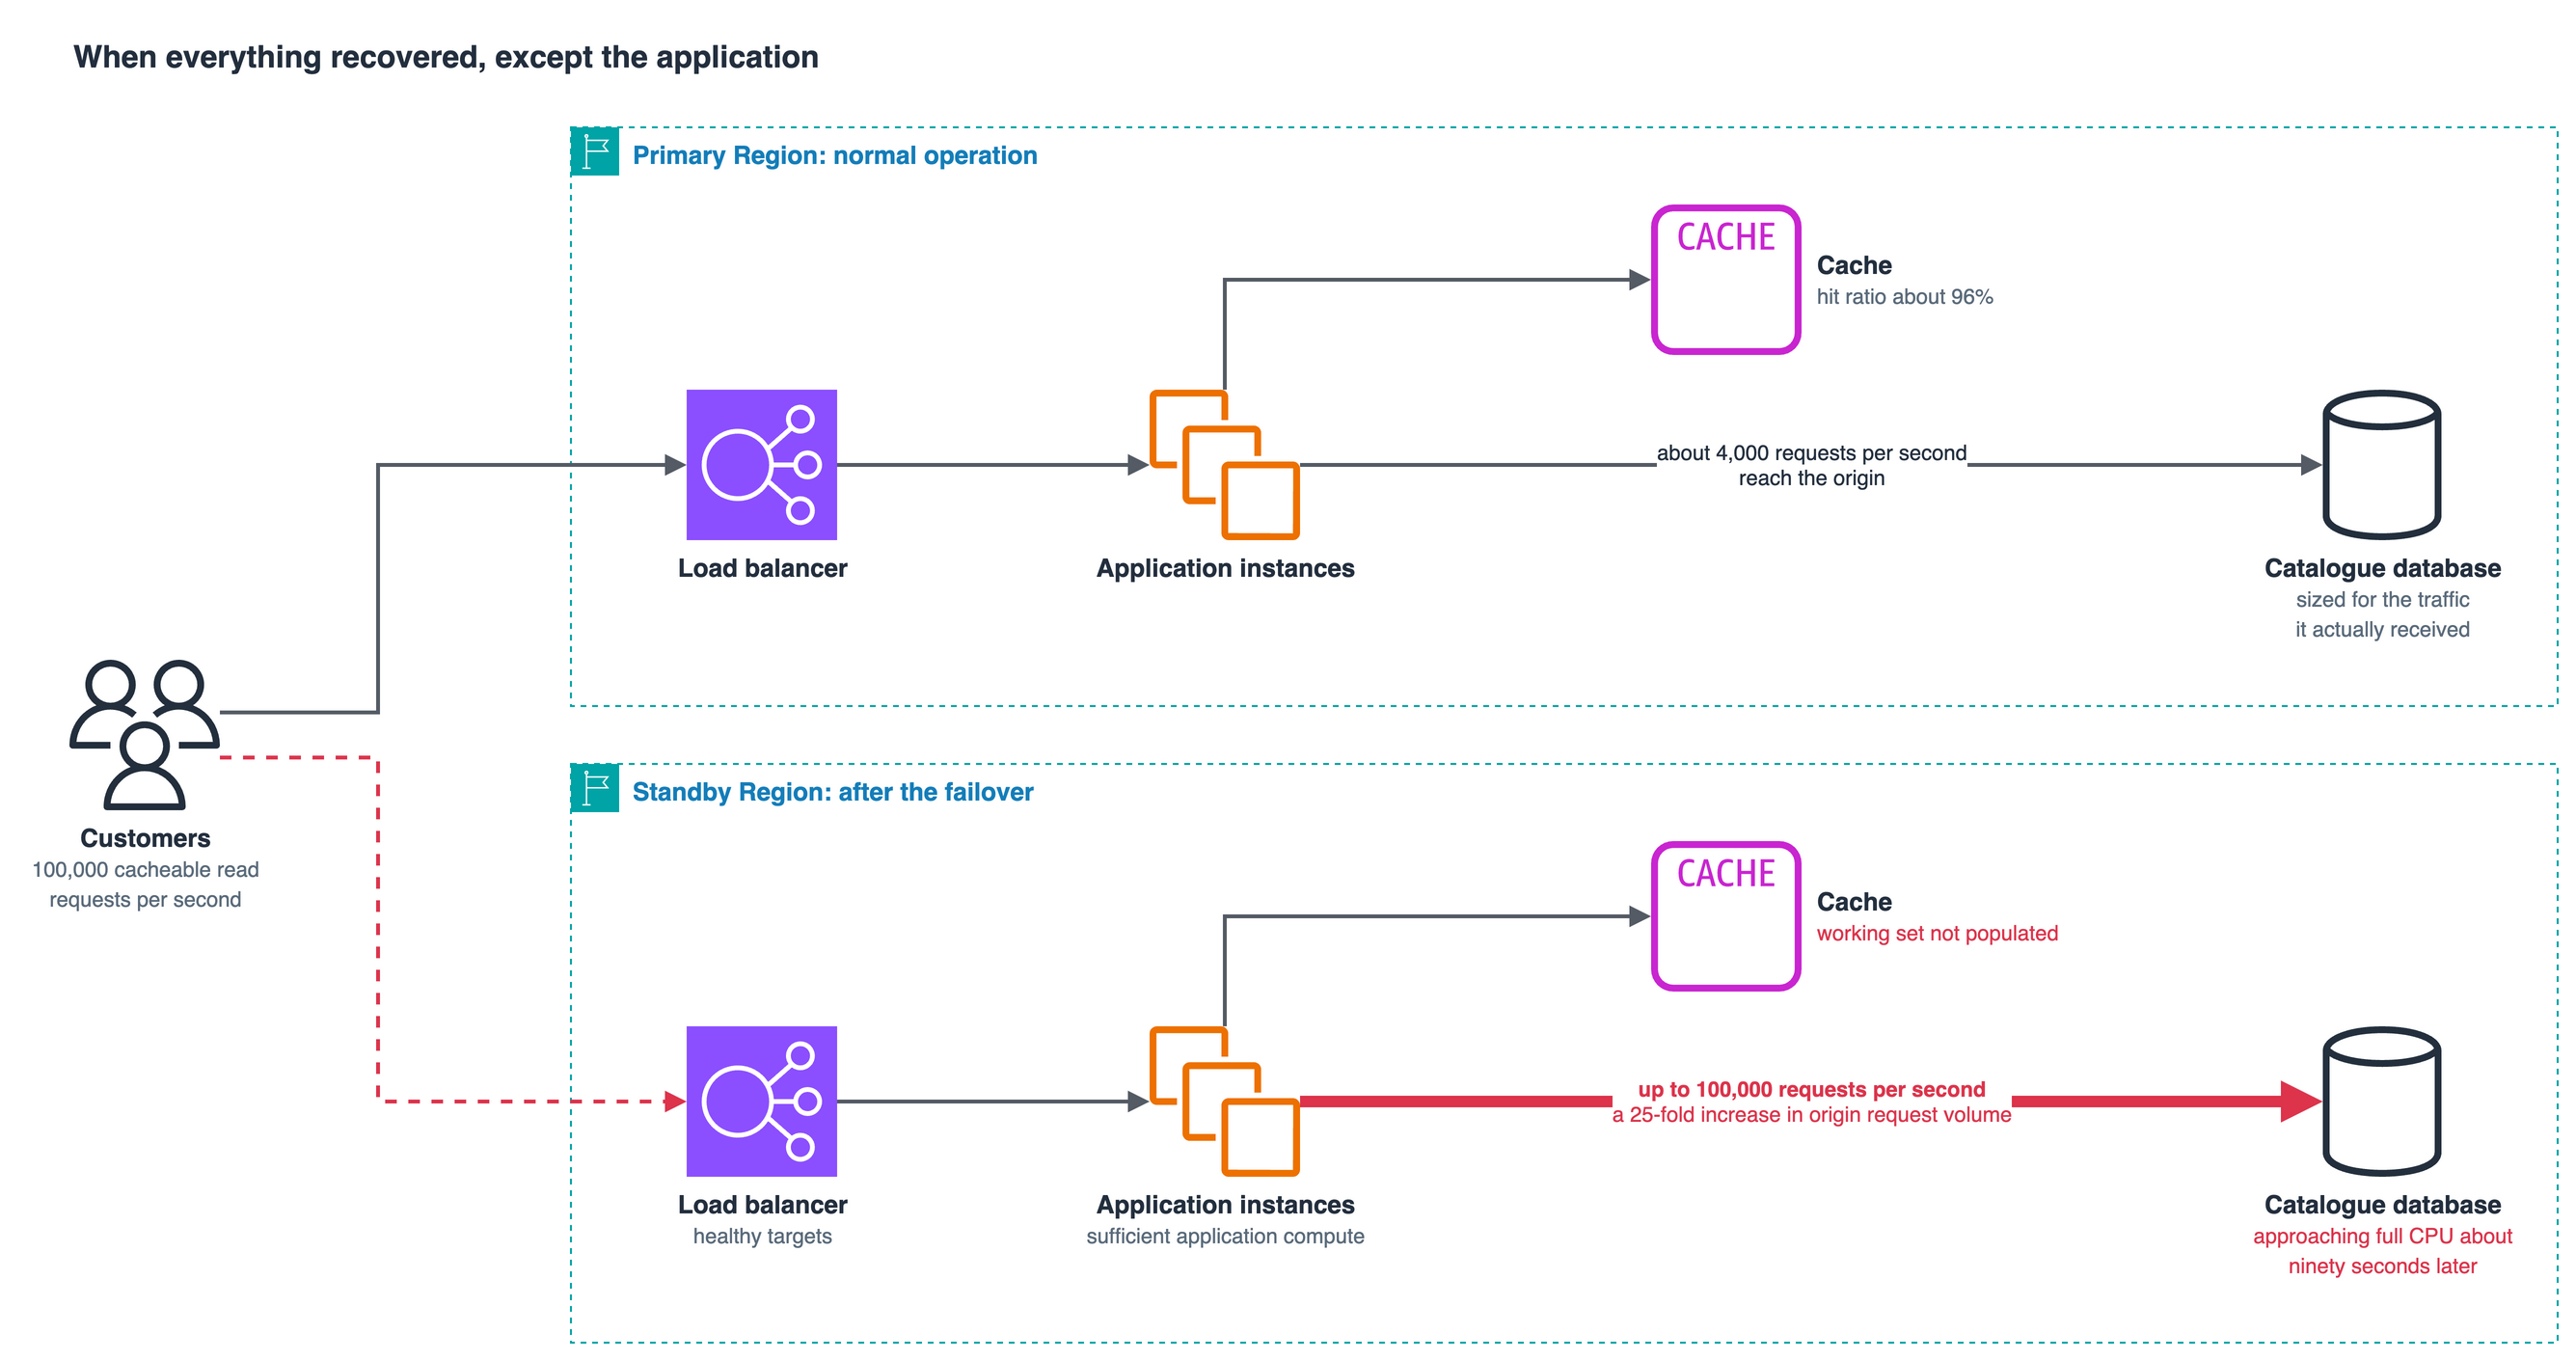
In the primary Region, the catalogue service normally operated with a cache hit ratio of approximately 96%. Most reads were satisfied from the cache without ever reaching the underlying database. Over time, this had become the normal operating condition of the application, and the database had been sized according to the traffic it actually received.
The standby environment had sufficient application compute, but its relevant cache working set had not been populated. The traffic was the same, the application code was the same, and the infrastructure looked remarkably similar. What had changed was the number of requests that suddenly needed to reach the database.
The team had prepared for the traffic their database normally handled. They had not prepared for the traffic that the cache normally prevented it from seeing.
That is the subtle danger of a system becoming efficient enough that we stop noticing what makes it efficient.
The arithmetic nobody wants to do during an incident
Consider an application receiving 100,000 cacheable read requests per second. Under normal operating conditions, its cache satisfies 96% of those requests, leaving approximately 4,000 requests per second for the origin.
For the sake of illustration, assume that each cache miss results in one origin request, and that the requests have comparable cost.
Now imagine the same application running after a regional failover, with a completely empty cache. Until the working set is rebuilt, essentially every request needs to reach the origin. Instead of 4,000 requests per second, the database may suddenly face 100,000.
That is a 25-fold increase in origin request volume, despite the fact that not a single additional user has arrived.
Nothing about the application’s advertised throughput has changed, and the compute fleet may be perfectly capable of accepting the traffic. What has changed is the amount of work required to serve each request.
Of course, real systems are rarely this neat. Some requests are more expensive than others, some trigger multiple downstream operations, some are not cacheable, and the distribution of frequently accessed keys matters enormously. But these complications make the capacity problem more important, not less.
When we say that an application can handle a certain amount of traffic, we are usually describing its performance under a collection of assumptions. We assume a particular cache hit ratio, a certain mix of requests, an expected level of database connection reuse, and a reasonably stable distribution of work across dependencies.
Over time, those assumptions become so familiar that they almost disappear from the capacity model.
Then an incident changes one of them.
The Amazon Builders’ Library describes how a service can become “addicted to its cache,” with caching gradually shifting from a performance optimization into something the application needs in order to function at its expected scale.
I find that description particularly accurate because addiction is rarely something a system designer deliberately chooses. Nobody sits down and decides that an optional optimization should become a critical dependency without which the service cannot operate.
It happens incrementally. The cache improves performance, so the database receives less traffic. The system grows, but database capacity is planned around the reduced load. Eventually, the application reaches a scale at which the cache is no longer merely making things faster; it is making the workload economically and operationally possible.
And as long as everything remains warm, the distinction is invisible.
Recovering a cache is not the same as recovering its usefulness
This is where the conversation becomes more nuanced, particularly when we look at the capabilities available in AWS today.
It would be incorrect to suggest that every cache failure, or every regional recovery, necessarily results in an empty cache.
Amazon ElastiCache, for example, supports Multi-AZ configurations with automatic failover, where an eligible replica can be promoted after a primary node fails. Because the replica already holds data, this is very different from rebuilding an entire cache cluster from empty nodes.
ElastiCache for Valkey also provides durability capabilities that can preserve acknowledged writes and support recovery of stored data. These capabilities materially improve recovery characteristics, and they should absolutely influence the architecture and the tests we design.
But there is an important distinction between preserving data and ensuring that the complete application path has the working set it needs when traffic returns.
A recovered cache might contain its previous data, while the local in-memory caches inside newly launched application instances are empty. A standby Region might have an operational cache cluster but not the same frequently accessed objects as the active Region. A content delivery layer might be warm for one traffic pattern and comparatively cold for another.
Even when data can be restored, there may be a period during which application performance and downstream request rates differ from their normal steady-state behavior.
That is why I would separate three questions that are too often treated as one.
Can the infrastructure recover? Can the required data survive or be restored? And can the recovered application immediately sustain the workload it is expected to serve?
Those are related questions, but they are not interchangeable.
AWS has continued improving the tooling available to answer parts of them. ElastiCache Insights for node-based Valkey clusters, introduced in October 2026, improves visibility into cache resources and workload behavior. That is useful when assessing whether the cache itself is approaching a resource limit or exhibiting abnormal performance.
Yet a cache can be healthy while the application remains dangerously dependent on it.
The cache metrics tell us how the cache is behaving. They do not, on their own, tell us whether the database behind it would survive if the hit ratio suddenly collapsed.
The dependency needs to be measured from both sides.
And the really unpleasant part is that the first wave of cache misses is not necessarily the most dangerous one.
When the herd discovers an empty cache
Imagine that the recovered application is a ticketing platform preparing for a major event. Thousands of customers are browsing the same catalogue, looking at the same popular performances and requesting information about the same availability windows.
Under normal conditions, these are exactly the requests caching handles beautifully. Once a popular object has been fetched, subsequent requests can reuse it without involving the database.
But immediately after a cold recovery, that object may not exist in the cache.
The first customer requests it, and the application asks the database. Before that database request completes, another customer asks for the same object. Then another, and another.
If each request independently attempts to populate the missing entry, thousands of customers asking essentially the same question can generate thousands of database operations.
This is the thundering herd problem, and it becomes particularly destructive when a large amount of traffic reaches an empty cache at once.
Engineers often respond to overload scenarios with retries, exponential backoff, and jitter. These are important mechanisms, especially when requests are failing and clients might otherwise retry in synchronized bursts.
But they address a different part of the problem.
Backoff and jitter help control when repeated attempts occur. They do not necessarily eliminate the duplicated work created by simultaneous requests for the same uncached object.
That is where request coalescing becomes valuable.
The concept is simple: if one request is already fetching a particular object, subsequent requests for that same object can wait for the existing operation rather than starting another independent fetch.
This is often called single-flight.
For a highly popular catalogue entry, many concurrent requests might therefore share one origin operation, rather than independently overwhelming the database.
Amazon CloudFront uses a related mechanism through Origin Shield. By introducing an additional shared caching layer, Origin Shield can consolidate requests for the same cacheable object and reduce the number of origin fetches, in favorable cases to as few as one.
The phrase “as few as one” matters because it describes a possibility, not a universal promise.
The effectiveness depends on the nature of the content, the cache key, and the request path. CloudFront Origin Shield is not a general-purpose solution for dynamically generated, personalized, or non-cacheable application queries. It also does not support gRPC requests through that layer.
If your application is performing user-specific database reads, the coordination may need to happen inside the application or through a suitable shared caching mechanism.
And there is another limitation that deserves attention: single-flight works by eliminating duplicate concurrent work for the same key. It does not make the cost of millions of genuinely distinct requests disappear.
Even a perfectly implemented coalescing mechanism cannot protect a database from more unique work than the database can perform.
That still requires capacity planning, concurrency controls, backpressure, and the ability to shed or defer work when dependencies become saturated.
Coalescing is not a substitute for those measures.
It is a way of making sure we are not wasting precious recovery capacity doing the same work thousands of times.
The moment the cache stops healing
Now consider what happens when the database starts struggling.
During a normal cache warm-up, a request misses the cache, retrieves the value from the origin, and stores that value for future requests. The next customer requesting the same object gets a cache hit, reducing the load on the database.
Over time, the cache becomes useful again, and the origin request rate starts falling.
But suppose the database is already overloaded. Some queries begin timing out or returning errors. Those failed requests do not produce successful values that can populate the cache, so the next request for the same object misses again.
And if clients respond to those failures with retries, the application can send even more requests to the dependency that is already struggling.
The cache is supposed to reduce the database’s workload as it warms. Instead, the database may be too overloaded to provide the responses needed to warm it.
That is how a temporary capacity problem can become self-sustaining.
It is also where negative caching enters the conversation.
Normally, we think about a cache as a place to store successful answers. But sometimes a negative answer is also useful information, and repeatedly asking for something we already know is unavailable only creates more work.
The Builders’ Library discusses this approach, including caching eligible error responses for a different duration than successful responses.
CloudFront has built-in error-caching behavior for certain HTTP response codes, with a default Error Caching Minimum TTL of ten seconds, subject to the relevant configuration and documented exceptions.
Ten seconds may sound insignificant, but in the middle of an overload event, avoiding repeated requests for the same failing resource can give an origin some room to recover.
However, this is not an invitation to cache every failure indiscriminately.
An HTTP 404 for a resource that genuinely does not exist is very different from a temporary 503 caused by an overloaded service. A user-specific authorization failure presents different considerations again, because incorrectly sharing or caching those responses may create security problems.
Negative caching must respect the semantics of the response, the identity and authorization context of the request, and the consequences of temporarily preserving an error after the dependency has recovered.
Short TTLs, careful cache-key design, and explicit rules about which responses may be reused are essential.
The point is not simply to cache failures. It is to prevent repeated, unnecessary work from accelerating an already difficult incident.
Sometimes the best answer is yesterday’s answer
There is another technique worth discussing, because it challenges an assumption many applications make without realizing it.
We often treat data as either valid or expired. A cached object has a TTL, and once the TTL passes, the application fetches a fresh copy from the origin.
That seems reasonable until the origin becomes unavailable.
Imagine that our catalogue service has a cached description of a performance, including its venue, date, and general details. The cached entry is slightly older than we would normally prefer, but the database is currently struggling.
Should the application discard that information and fail the request because it cannot retrieve a fresh copy?
Or would it be better to continue displaying the existing information, provided the business has explicitly decided that a limited amount of staleness is acceptable?
This is where soft and hard TTLs become useful.
A soft TTL indicates when the application should attempt to refresh the data. A hard TTL establishes the point beyond which the old value must no longer be used.
Between those two boundaries, the application may continue serving an eligible cached value while refreshing it in the background.
If the refresh succeeds, the cache becomes fresh again. If it fails, the application can preserve the existing value for the permitted period rather than throwing away useful state precisely when its dependencies are least reliable.
CloudFront supports related behavior through the HTTP directives stale-while-revalidate and stale-if-error, subject to its cache configuration and maximum TTL constraints.
This is particularly useful for content where freshness is desirable but temporary staleness is acceptable.
It is not appropriate everywhere. Displaying a slightly outdated event description may be fine, while displaying an outdated payment result, inventory commitment, or authorization decision could be unacceptable.
The business requirements and consistency model must determine the policy.
But the principle is powerful: an application does not always need to choose between a perfectly fresh answer and complete failure.
There can be a deliberate middle ground.
The AWS Well-Architected Reliability Pillar makes this point through its guidance on graceful degradation, encouraging systems to continue delivering their core functions when dependencies become unavailable, even if that means serving reduced functionality or suitably stale information.
It also warns against invalidating useful local state following a failed refresh without considering the consequences.
The trouble, of course, is that every technique we have just discussed has a common prerequisite.
To serve stale content, you must already have content to serve.
A completely cold cache has nothing stale to offer.
And that brings us back to the uncomfortable difference between recovery and readiness.
The recovery test that changes the conversation
I have seen many recovery discussions focus on the mechanics of getting infrastructure running again.
How quickly can we launch the fleet? How fast can we redirect traffic? Is the database available? Are the targets healthy? Are the service quotas sufficient?
These are legitimate questions, and they absolutely belong in a resilience review.
But they are not enough.
The Builders’ Library recommends testing systems with caches disabled to understand their behavior without the cache. It is deceptively simple advice, because the result can reveal capacity assumptions that have been hidden for years.
Naturally, such testing needs to happen in a controlled environment, with representative workloads and safeguards to avoid harming production dependencies.
For a regional recovery design, however, I would go beyond simply disabling the cache.
I would want to understand how the application behaves during the transition from cold to warm.
How many requests reach the database when traffic first arrives? How rapidly does the hit ratio improve? What happens if the database begins throttling during that period? Do failed requests produce repeated work, or does the application coordinate them? Can we gradually introduce traffic without exceeding the origin’s capacity?
And, perhaps most importantly, how long does it take before the service can sustainably meet its expected performance and availability objectives?
Because if your Recovery Time Objective is ten minutes, but your application needs fifteen minutes to rebuild a sufficiently useful working set, reporting that the infrastructure recovered in two minutes is not a particularly meaningful success.
You have recovered the machinery.
You have not recovered the service within its objective.
This is why I think we need to be more careful when interpreting healthy infrastructure during an incident. A load balancer can verify that an application responds to health checks. That tells us something valuable, but it does not establish that every dependency can sustain the full production workload that is about to arrive.
Likewise, a cache cluster reporting healthy nodes tells us that the cache infrastructure is functioning. It does not establish that the right data is present, or that the application can survive the misses.
Recovery readiness needs to include the conditions under which the application normally achieves its capacity.
Otherwise, we are testing whether the system can restart while assuming it will somehow remember how to perform.
A resource we never put on the diagram
I keep returning to this because the pattern extends well beyond caching.
Think about a hospital operating close to capacity because patient discharge is efficient. Everything works beautifully as long as patients can continue leaving at the expected rate. If that process stalls, the hospital can become overwhelmed without a sudden increase in arrivals.
Or consider a software team whose delivery depends on one engineer’s knowledge of an undocumented system. Its apparent productivity includes a resource that does not show up in any formal capacity model.
A just-in-time supply chain has a similar property. Removing inventory improves efficiency until replenishment becomes unreliable, at which point the missing buffer suddenly becomes the most important resource in the operation.
In all three cases, the system has become dependent on conditions that are treated as normal rather than as explicit requirements.
A warm cache is no different.
It represents work that has already been performed, data that has already been retrieved, and load that the origin no longer needs to absorb. That accumulated state contributes directly to the effective capacity of the system.
When we lose it, we lose more than a performance optimization. We may lose part of the capacity that made the architecture viable at its expected scale.
That is why I like to think of a cache as borrowed capacity, with warmth as the collateral.
And like any borrowed resource, it deserves a place in the risk model.
so…
This week, I would add another question to that same review.
If the infrastructure recovers but the cache is empty, how much of our expected workload can we really serve, and how long will it take before we can serve the rest?
A team that knows its normal cache hit ratio but has never measured what happens when that ratio approaches zero does not yet have a complete capacity model.
It has a model of a good day.
Failover gets you a system. It does not get you a warm one.
What’s next
We have now followed the recovery journey through two problems that often hide behind a successful architecture diagram. First, the destination Region must actually have the capacity and entitlements required to run the workload. Then, even when that infrastructure becomes available, the application may need time and protection to rebuild the state on which its effective capacity depends.
Suppose we have solved both problems. The quotas were there, the fleet recovered, the cache refilled, and the origin survived the transition.
Surely the dashboards will tell us when everything is healthy again?
Next week, I want to challenge that assumption.
We will look at why metrics can turn green before users actually recover, how averages can hide traffic that never arrived, why latency percentiles sometimes appear to improve when requests fail instead of completing, and how measuring health from inside a struggling system can create an extremely convincing illusion of recovery.
Because there is something particularly dangerous about an incident that looks finished before it really is.
Get Failover Weekly by email
One essay every two weeks, plus a short note when a new article is published here.