Failover Weekly No. 16
I Pointed a Browser at the Internet's Nervous System. Here's What It Taught Me About Signal and Noise.
How a single HTML file, one WebSocket, and the RIPE routing feed became a live Internet resilience dashboard — and why the hard part was never the data.
There’s a version of this story that’s about a slick dashboard. Glowing collectors on a dark map, beams arcing between continents, a resilience gauge ticking in real time. That version is fun to look at and tells you almost nothing.
The real story is about a problem every resilience engineer eventually runs into, whether they’re watching BGP or a service mesh or a database cluster: the raw signal is mostly noise, and the entire craft is deciding what “normal” looks like before you’re allowed to call anything “wrong.”
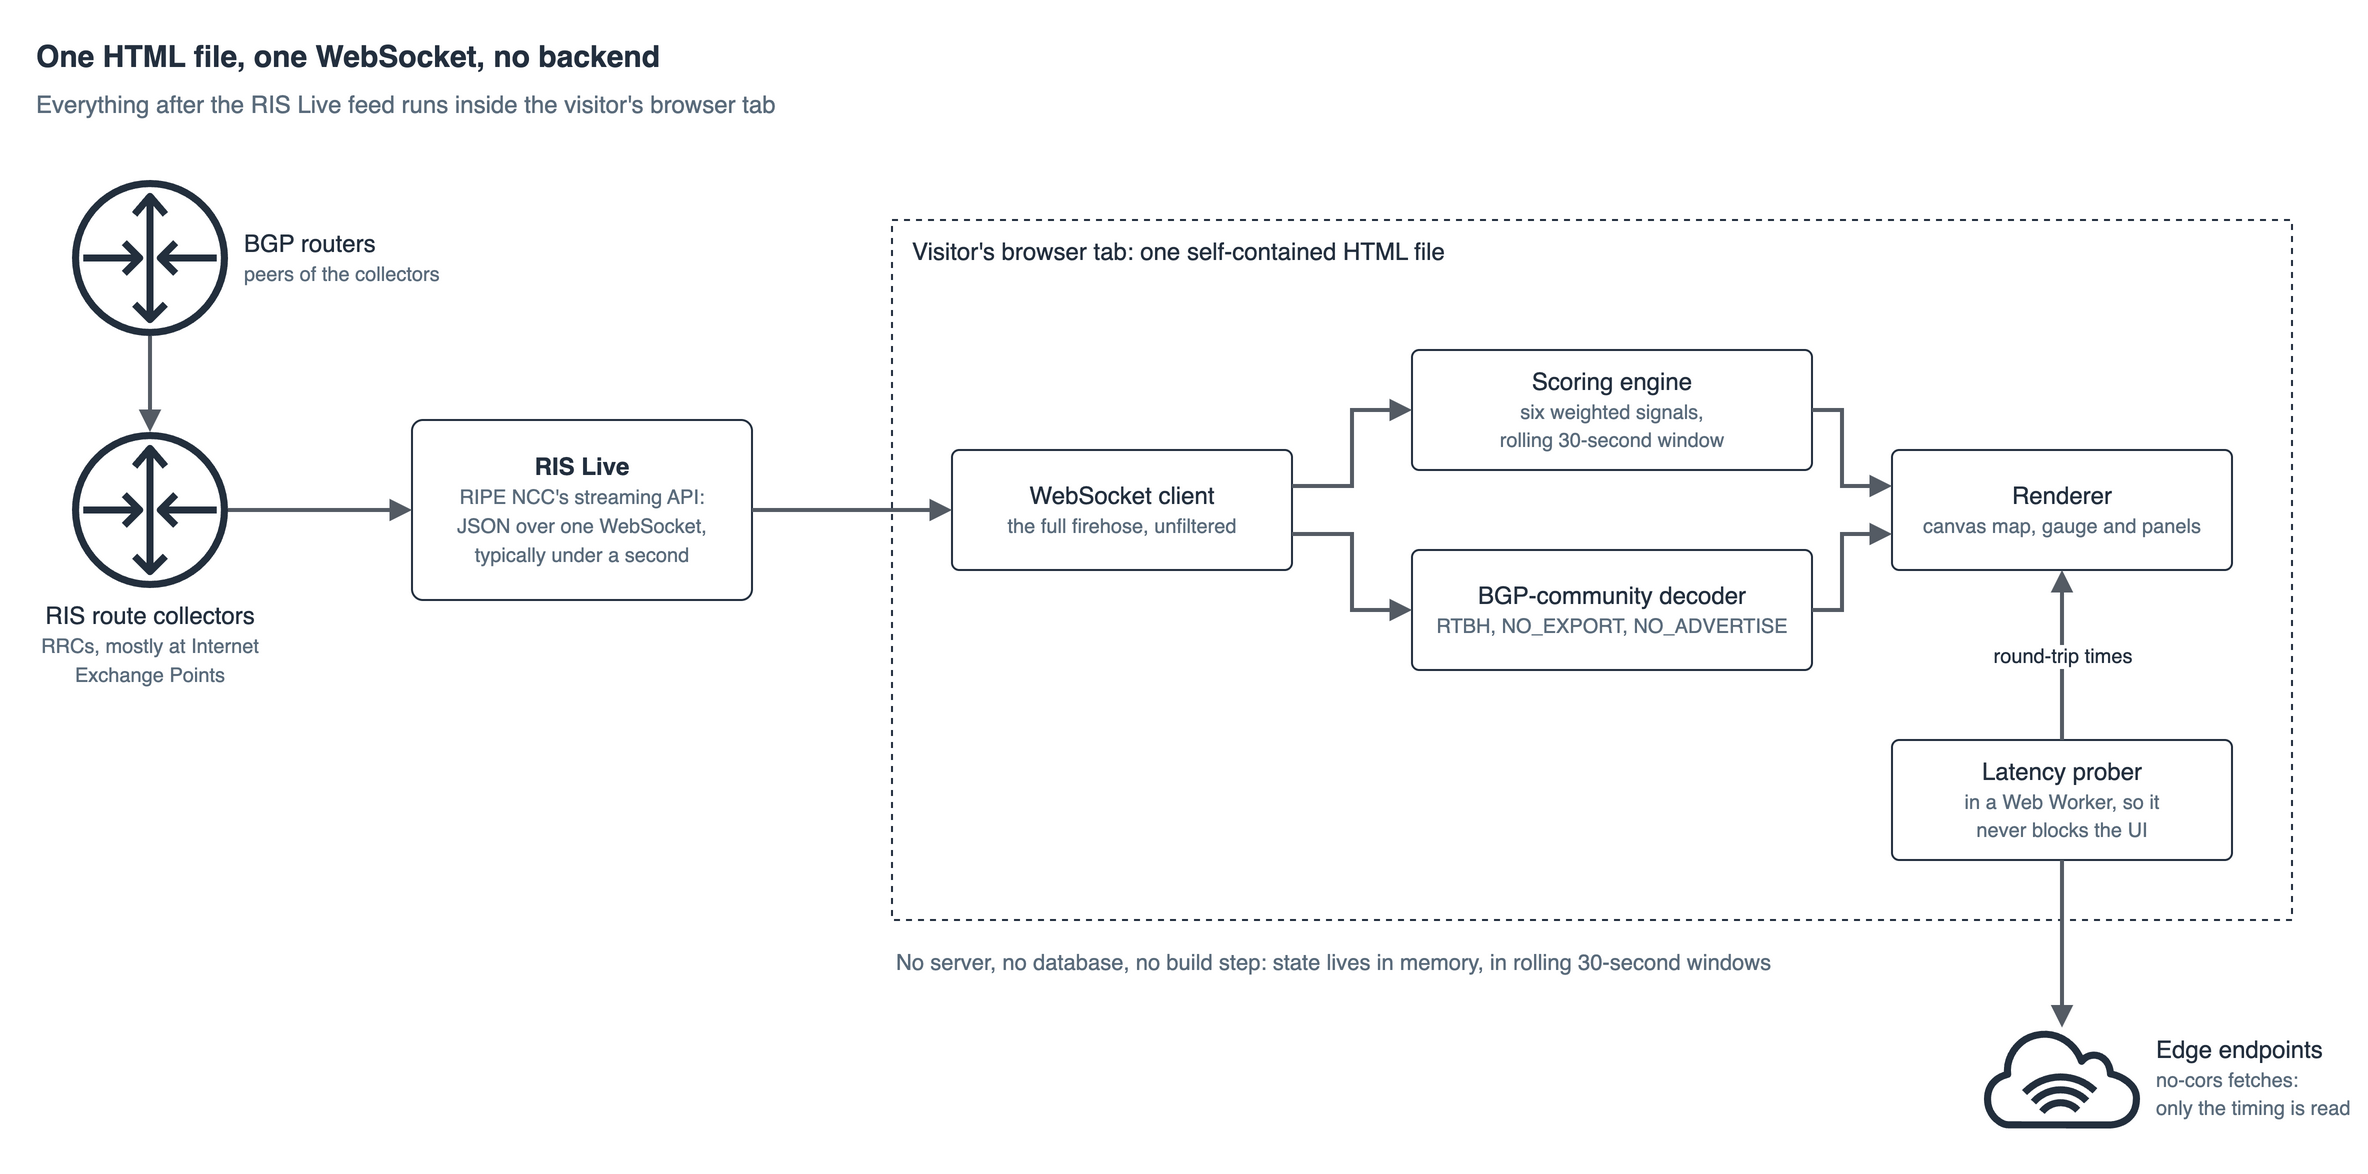
I built the Internet Resilience Dashboard on my site to make that problem visible. It streams live routing data from the global Internet, scores its health continuously, and decodes the operational intent buried inside BGP messages — all inside your browser tab, with no backend, no database, and no build step. One file.
This is a walkthrough of how it works, what’s real, what’s illustrative, and the one lesson I keep relearning: the difference between a monitoring toy and a monitoring tool is entirely in how you handle the noise floor.
Let me take you through it, layer by layer.
Layer 1 — Where the data actually comes from
The entire thing is fed by one source: RIPE NCC’s Routing Information Service, via the RIS Live streaming API.
RIS has been running since 1999. It’s a worldwide network of BGP route collectors — the RRCs — deployed mostly at Internet Exchange Points, each peering with many real BGP routers and recording every routing change those peers see. RIS Live is the real-time front door to that infrastructure: it aggregates updates from the collectors and pushes them out as JSON over a single WebSocket, typically less than a second after the original BGP message was observed on the wire.
The dashboard opens exactly one connection:
function connectWS() {
  const ws = new WebSocket('wss://ris-live.ripe.net/v1/ws/?client=critelli-cv');
  ws.onopen = () => {
    ws.send(JSON.stringify({ type: 'ris_subscribe', data: {} }));
  };
}
That empty data: {} subscription is deliberate. RIS Live lets you filter server-side — by prefix, by AS path, by collector — but I subscribe to the full firehose: every announcement and withdrawal, from every peer, worldwide. No filtering. This is the aggressive choice, and it’s the entire point. If you’re building a resilience view, you don’t get to pre-decide which events matter. You take everything and let the scoring layer sort it out.
Every message that arrives looks like this (simplified):
{
  "type": "ris_message",
  "data": {
    "timestamp": 1568279796.63,
    "peer": "192.0.2.0",
    "peer_asn": "64496",
    "host": "rrc21",
    "type": "UPDATE",
    "path": [1, 2, 3, 4],
    "community": [[64496, 1111], [64497, 2222]],
    "announcements": [
      { "next_hop": "192.0.2.0", "prefixes": ["192.0.3.0/24"] }
    ],
    "withdrawals": ["192.0.4.0/24"]
  }
}
The handler ignores anything that isn’t a ris_message, then splits on the two events that carry almost all the meaning: announcements (a network is telling the world “you can reach this prefix through me”) and withdrawals (“you can’t reach it through me anymore”).
That announcement-versus-withdrawal balance is the heartbeat. Hold onto it — it’s about to become the single most important number in the whole system.
Layer 2 — The map, and an honest confession
The dashboard renders 19 real RIPE collectors at their true geographic coordinates — Amsterdam, London, Geneva, Frankfurt, Singapore, São Paulo, Johannesburg, Dubai, and more. Each incoming event gets attributed to its originating collector via the host field, which drives the pulsing dots and the animated beams.
Now the confession, because I’d rather you hear it from me than find it in the source (which you’re welcome to read — it’s all client-side).
There is a 20th collector, Sydney, and it is not real. RIPE has no RRC in Sydney. I create a virtual one — labeled Sydney* with an asterisk in the UI — and I route Australian-origin ASNs to it so the Asia-Pacific region has geographic representation on the map:
const colls = [
  // ... the 19 real RIPE collectors ...
  { id: 'virt-syd', name: 'Sydney*', lon: 151.2, lat: -33.9, reg: 'ap' },
];

// Route Australian ASN events to Sydney virtual collector
const sydneyIdx = colls.findIndex(x => x.id === 'virt-syd');
if (fullPath.length > 0) {
  const last = fullPath[fullPath.length - 1];
  const origin = Array.isArray(last) ? last[0] : last;
  if (auASNs.has(origin) && sydneyIdx >= 0) ci = sydneyIdx;
}
Similarly, a few purely cosmetic touches use randomness. When a message arrives without a usable host, the beam animation picks a random collector rather than dropping the event visually. Regional scores carry a tiny ±1.5 point jitter so they breathe instead of freezing on a round number.
Here’s why I’m telling you this in a technical newsletter instead of hiding it: the metrics are real; some of the geography is a visualization. Every number the scoring engine produces comes from actual RIS data. The map is a storytelling surface layered on top. Conflating those two would be exactly the kind of dishonesty that makes dashboards untrustworthy — and untrustworthy is the opposite of what a resilience tool is for. If you can’t tell your users which pixels are measured and which are illustrative, you don’t have a monitoring system, you have a screensaver.
With that out of the way, let’s get to the part that actually matters.
Layer 3 — The noise floor, or why “8% of the Internet is failing” is a healthy reading
Here is the trap, and it’s the whole reason this project exists.
If you naively stream BGP and flag every withdrawal as a problem, your dashboard will scream continuously and mean nothing. Because the healthy Internet is astonishingly noisy. At any given second, prefixes are being withdrawn and re-announced constantly — links flap, sessions reset, routes converge, operators reconfigure. The dashboard treats a steady 8–20% withdrawal ratio as completely normal. More than half of all prefixes on the Internet are /24s — the most specific IPv4 block routinely accepted — and that deaggregation is business as usual, not an attack.
So the foundational engineering decision isn’t “how do I detect withdrawals.” It’s “what withdrawal ratio is normal, and how far past it means trouble?” Get that threshold wrong and you’ve built either a smoke alarm that never stops or one that never goes off.
The dashboard answers this with a weighted composite score across six independent signals. Not one metric — six, because any single dimension of BGP health is trivially foolable and real resilience is multi-factor. Here are the actual weights from the source:
// Weights: withdrawal ratio 35%, flap severity 20%, MOAS 15%, convergence 15%, loops 5%, deagg 10%And critically — every threshold is calibrated to the real noise floor, not to an idealized zero. This is the withdrawal-ratio scoring, verbatim:
// 1. Withdrawal ratio (35%) — real internet is 8-20% withdrawals normally
const wdRatio = win.w / t;
const wdScore = wdRatio < 0.10 ? 100 : wdRatio < 0.20 ? 90 : wdRatio < 0.30 ? 75 : wdRatio < 0.45 ? 55 : 35;
Read what that says. A 15% withdrawal ratio scores 90 — healthy. It only starts genuinely degrading past 30%, and only hits crisis past 45%. The system is explicitly built to treat ordinary Internet churn as the baseline and reserve alarm for statistically abnormal conditions. The intelligence isn’t in measuring the withdrawals. It’s in knowing that 15% is fine and 50% is a very bad day.
The other five signals follow the same philosophy — each one encodes “here’s what the healthy Internet already does, flag only the excess”:
-
MOAS is scored as a ratio against total observed prefixes, because plenty of MOAS is legitimate — anycast and multi-homing produce it by design. Only a spike relative to baseline is suspicious.
-
Route flap tolerates constant low-level flapping (it always exists) and only penalizes when many prefixes flap 3+ times inside a 30-second window.
-
Path anomalies carefully strip AS-path prepending — the same ASN appearing consecutively, which is a normal traffic-engineering technique — and count only non-consecutive duplicate ASNs, which indicate a real routing loop. This distinction is the entire difference between a false positive and a genuine finding:
const flat = fullPath.map(x => Array.isArray(x) ? x[0] : x);
// Remove consecutive duplicates (prepending) first
const deduped = flat.filter((a, i) => i === 0 || a !== flat[i - 1]);
if (deduped.length > 2) {
  const seen = new Set();
  let dup = null;
  for (const a of deduped) {
    if (seen.has(a)) { dup = a; break; }
    seen.add(a);
  }
  if (dup !== null) loopCount++;
}
The six scores combine into one composite:
const composite =
  wdScore * 0.35 + flapScore * 0.20 + moasScore * 0.15 +
  convScore * 0.15 + loopScoreVal * 0.05 + deaggScore * 0.10;
return Math.max(35, Math.min(100, composite));
Which maps to three states — Healthy (≥95), Degraded (65–94), Critical (<65) — driving the gauge and coloring every country polygon on the map by its regional sub-score.
One more calibration detail that matters more than it looks: the score runs over a rolling 30-second window, not all-time totals. A burst of withdrawals two minutes ago shouldn’t drag down a currently-healthy Internet. Resilience is a present-tense property, so the measurement has to forget the past at a deliberate rate:
const SCORE_WINDOW_MS = 30000;

function trimWindow(arr) {
  const cutoff = Date.now() - SCORE_WINDOW_MS;
  while (arr.length > 0 && arr[0].t < cutoff) arr.shift();
}

function windowRatio(arr) {
  trimWindow(arr);
  if (arr.length < 5) return { a: 0, w: 0, total: 0 };
  let a = 0, w = 0;
  arr.forEach(e => { if (e.type === 'a') a++; else w++; });
  return { a, w, total: a + w };
}
Note the arr.length < 5 guard. Below five samples, the system refuses to render a confident score and holds neutral. A monitoring tool that panics on three data points is worse than useless — small-sample restraint is as much a part of the design as the thresholds themselves.
That’s the whole lesson, and it generalizes far past BGP: a good health score is 10% measurement and 90% knowing what to ignore.
Layer 4 — Decoding intent: reading the operator’s mind through BGP communities
The scoring tells you whether the Internet is healthy. The next layer tells you what operators are actually doing — and this is where public routing data gets genuinely fascinating, because BGP updates carry communities: tags networks attach to routes to signal intent.
Most are private and specific to one network. But a handful are effectively universal, and the dashboard decodes them live:
comms.forEach(c => {
  const val = Array.isArray(c) ? c[1] : c;
  const asv = Array.isArray(c) ? c[0] : 0;
  if (val === 666) commRtbhCnt++;
  else if ((asv === 65535 && val === 65281) || (asv === 65535 && val === 65282)) commNoexCnt++;
  else commTeCnt++;
});
That 666 is one of the most operationally loaded numbers in networking. By long-standing convention, the :666 community triggers a Remote-Triggered Blackhole — an operator deliberately dropping all traffic to a prefix, almost always to null-route an incoming DDoS attack. When you see RTBH communities flowing across the live feed, you are frequently watching a network defend itself against an attack, in real time, from a browser tab. That still amazes me every time.
The dashboard surfaces several of these intent signals side by side:
-
RTBH (:666) — blackholing, the fingerprint of active DDoS mitigation
-
NO_EXPORT / NO_ADVERTISE (65535:65281/65282) — scope-limiting, “don’t propagate this beyond here”
-
Traffic-engineering communities — the everyday levers operators pull to steer paths
-
First-seen prefixes — brand-new announcements never observed before this session (deaggregation events, or potential hijacks worth a second look)
-
Convergence timing — measured directly by matching a withdrawal of a prefix to its subsequent re-announcement and clocking the delta:
if (!isA && pfx && pfx !== '?') {
  wdlTimes.set(pfx, now);
} else if (isA && pfx && wdlTimes.has(pfx)) {
  const delta = now - wdlTimes.get(pfx);
  if (delta > 0 && delta < 30000) convTimes.push({ ts: now, d: delta });
  wdlTimes.delete(pfx);
}
That convergence measurement is a small thing that captures a big idea: resilience isn’t whether something fails, it’s how fast it recovers. A prefix that vanishes and returns in 800ms is a healthy self-healing system doing its job. The same prefix taking 20 seconds is a problem. The dashboard measures the recovery, not just the failure — which is, in one sentence, the entire premise of resilience engineering.
Layer 5 — A second, independent data plane: live latency probing
BGP tells you about reachability — whether routes exist. It says nothing about experience — whether the path is actually fast. So the dashboard runs a completely separate measurement, in a Web Worker so it never blocks the UI, that probes real edge endpoints and clocks round-trip time:
async function probe() {
  const results = [];
  for (const t of targets) {
    const start = performance.now();
    try {
      const ctrl = new AbortController();
      const timer = setTimeout(() => ctrl.abort(), 4000);
      await fetch(t.url, { mode: 'no-cors', cache: 'no-store', signal: ctrl.signal });
      clearTimeout(timer);
      const ms = Math.round(performance.now() - start);
      results.push({ id: t.id, ms: ms < 5 ? -2 : ms });
    } catch (e) {
      const ms = Math.round(performance.now() - start);
      results.push({ id: t.id, ms: ms > 3500 ? -1 : ms < 5 ? -2 : ms });
    }
  }
  postMessage(results);
}
Because these are no-cors fetches, the browser won’t let the code read the response — but it doesn’t need to. It only needs the timing, and performance.now() gives it that. The results classify into fast (<80ms), mid (<200ms), and slow, with blocked or timed-out targets flagged distinctly rather than silently dropped.
The point of pairing the two planes: reachability and performance are different failure modes. A route can be perfectly valid and still slow; a path can be fast right up until it disappears. Watching both at once is closer to how resilience actually behaves in production — the interesting failures live in the gap between “it’s up” and “it’s good.”
Layer 6 — The constraint that made it interesting: one file, no backend
Everything above runs in a single, self-contained HTML file. No server. No database. No build pipeline. No dependencies. You open the page and your browser becomes the entire analytics stack — WebSocket client, six-factor scoring engine, BGP-community decoder, latency prober, and canvas renderer, all client-side.
That constraint wasn’t laziness; it was the design brief, and it forced a genuinely useful discipline:
-
The browser is the compute. All aggregation and scoring happen in the client. Zero server cost, zero data egress, infinitely scalable because every visitor runs their own instance.
-
State lives in memory, in rolling windows. No persistence layer means the code has to be honest about time — hence the 30-second windows and small-sample guards. You can’t lean on a database to remember things for you, so you’re forced to define exactly how long a signal stays relevant.
-
Reconnection is not optional. Long-lived WebSockets will drop — server restarts, transient network blips, the connection sitting open indefinitely. The handler treats disconnection as an expected state, not an error, and self-heals:
ws.onclose = () => setTimeout(connectWS, 3000);
ws.onerror = () => ws.close();
There’s something fitting about that: a dashboard about Internet resilience whose own first requirement is to survive its own connection failing. The tool has to embody the property it measures.
The actual takeaway
If you take one thing from this, don’t let it be “cool map.” Let it be this:
The engineering was never in getting the data. RIS Live hands you the Internet’s routing updates for free, over one WebSocket, in under a second. Anyone can catch that firehose. The craft — the part that separates a monitoring tool from a monitoring toy — is everything that happens next: deciding that 15% withdrawals is healthy and 50% is a crisis, stripping prepending so you don’t cry wolf on every path, scoring six signals instead of trusting any one, forgetting the past at a deliberate rate, and refusing to render a confident number from three data points.
That’s resilience monitoring in miniature, and it’s the same discipline whether you’re watching BGP, a Kubernetes cluster, or a multi-Region failover. Raw telemetry is cheap and abundant. Calibrated judgment about what “normal” looks like is the entire job. The noise floor isn’t an obstacle to the signal — defining the noise floor is the signal.
The whole thing is live and running right now. Open it, watch the RTBH events roll past, and remember: somewhere out there, in real time, a network is defending itself — and you’re watching it happen in a browser tab.
Built on public data from RIPE NCC RIS Live. The dashboard is a demonstration of what’s possible with open Internet measurement infrastructure — the metrics are computed from real routing data; the map geography includes one clearly-labeled virtual collector and some cosmetic visualization choices, disclosed above in the spirit of the thing.
If you build monitoring, watch routing, or just think resilience is one of the more underrated disciplines in our field — I’d genuinely like to hear how you draw your own noise floor. That problem never really gets solved, only recalibrated.
and one more thing… while you are there, have a look tot he Resilience Lab… this will be next one in line I will discuss on the newsletter…
Get Failover Weekly by email
One essay every two weeks, plus a short note when a new article is published here.